
From Lunático we have been playing around a little bit with Node-RED – as they say “…a programming tool for wiring together hardware devices, APIs and online services in new and interesting ways.”
Truth is, it is fun, quite easy, and very useful and interesting things can be accomplished with relatively little effort.
I set my self to test and display a few data from the Solo, but ended up with a mostly complete dashboard: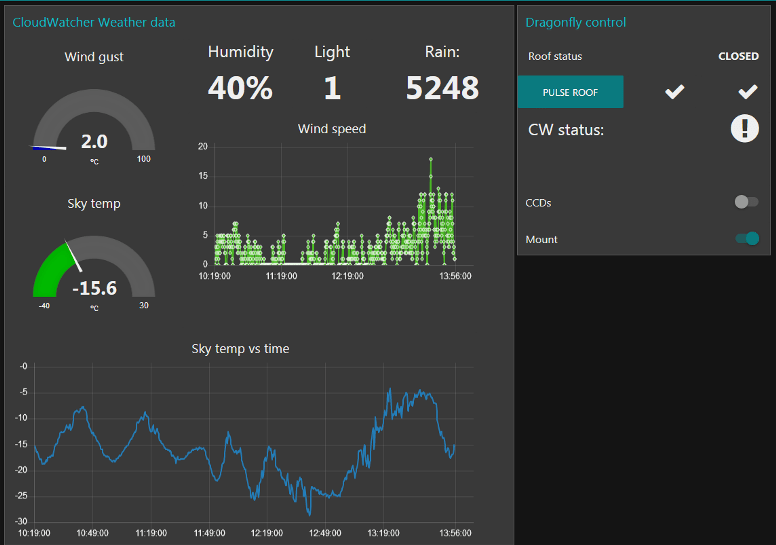
Search the web for examples of things done with Node-RED. It basically allows you – as said, quite easily – to connect “things”, manipulate data, and display it. Display it in a browser, by the way, everything is browser-based.
Word of warning: proceed at your own risk. This is quite interesting, entertaining, and can soak your time at an alarming rate. Read or watch some tutorial(s) first. No warranties.
Let’s see now how I did the CloudWatcher part of the dashboard.
First of all, you’ll have to install Node-RED, and then the dashboard and the averaged bars. To install Node-RED follow the instructions here, then, from the command prompt, type:
>>npm install node-red-dashboard
>>npm install node-red-contrib-dashboard-average-bars Once done, launch Node-RED:
Once done, launch Node-RED:
>> node-red …
and open your browser and make it point to http://localhost:1880, you’ll jump into the editor:
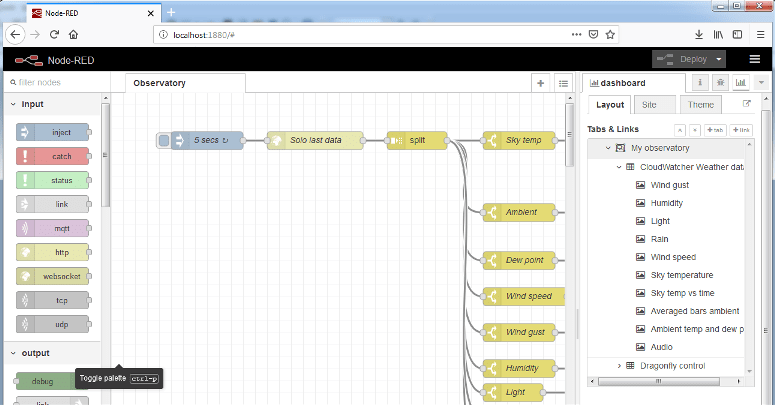
What you see above is after importing (top right menu, import, clipborad, select file…) the flow I’ve written (download link). → https://lunatico.es/dev/SoloDragonflyNodeRED.json
I’ve had to visit the Node-RED pages quite a few times, looking for information, examples, etc.
Ok, so, to the CloudWatcher / Solo: this is quite easy to do, and the Solo helps a lot.
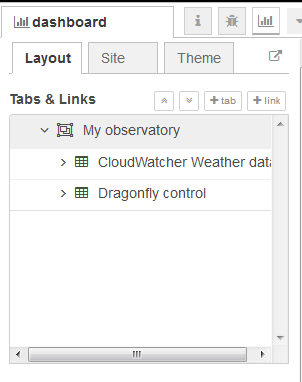
First create a “tab” in the dashboard editing section, right side, and then a group inside the tab. In the image, you see two groups (CloudWatcher, Dragonfly) in “My observatory” tab.
Now the idea is to:
- get data from the Solo (connecting to aagsolo/cgi-bin/cgiLastData)
- split the data
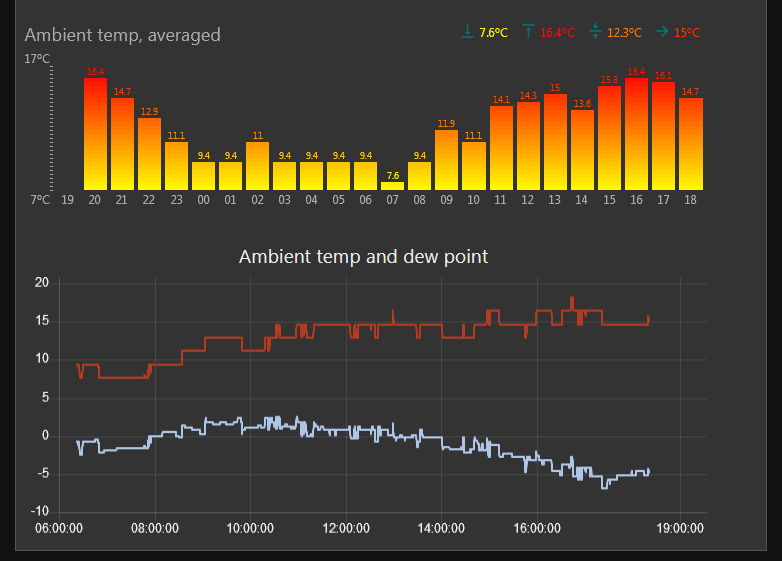
- get each item and display it (same data can be displayed in several ways, and combined with other data in a mixed graph…)
There are endless options for the graphs, especially if you search for user contributions – the averaged bars graph here is one of those. At one point one has to choose, so…
My flow is as follows:
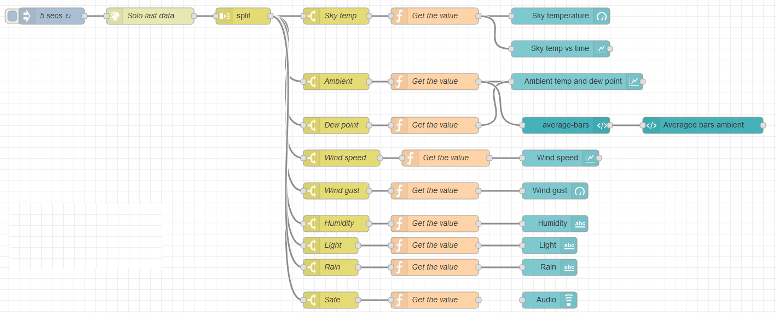
The first node just “starts the thing” every 5 seconds. This is fine for testing but is changed to 30 seconds in the final version.
The second one, “Solo last data”, makes the web request, then “Split” divides the data received line by line. By the way, the output of the Solo cgiLastData is:
- dataGMTTime=2019/04/02 17:55:41
- cwinfo=Serial: 1222, FW: 5.7
- clouds=-17.780000
- temp=16.400000
- wind=3
- gust=4
- rain=5376
- light=1
- switch=0
- safe=0
- hum=42
- dewp=3.450000
Now there’s a switch node for each value I want to process – these just check the input for a word (let’s say “wind”), and if found, pass the data to the next step, where there’s a very small function to take the value, and sometimes add something else.
So, each X seconds, a request is made, then split, then searched for each value, then the actual numeric value is extracted, and last it is represented using some of the available options.
There is most likely a better or smarter way to do this but this one works, is simple, and straightforward.
Now to the Dragonfly control – a tad more difficult as we have to send, receive and check things.
The goal I set myself was:
-
- being able to power on and off the CCDs and mount
- open and close the roof
- check the status of the roof, and warn in case of errors
- display the safety status via the CloudWatcher relay
Let’s see it in 2 sections, first the part where information is sent to the Dragonfly:
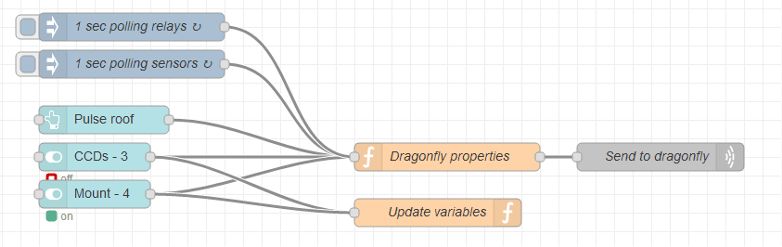
Similarly to what we had for the Solo, now there are 2 units “launching the thing” every second. In each one of them, the payload (the information that flows with the flow…) is loaded with the message we want to send to the Dragonfly. The function “Dragonfly properties” loads the address of the Dragonfly (In windows you can use the name, “Dragonfly” by default; in Linux or other Oses you’ll have to specify the IP address). Finally, “send to dragonfly” is a UDP sending box that will do exactly as its name implies.
Other than that, there’s a button to pulse the roof relay, and two “on/off” switches to power the CCDs and mount on and off.
The update variables is a small function to save the value of the CCD and mount switch; it will get meaning later.
Then there is the part where we process what the Dragonfly sends:
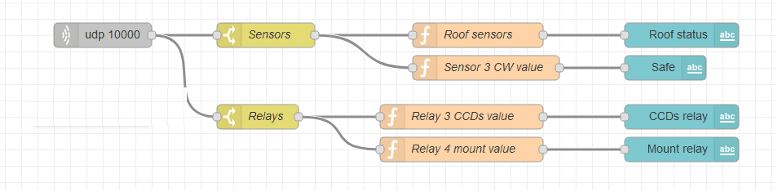
We receive whatever the Dragonfly sends (UDP port 10000), and divide it between sensor information, and relay information.
With the sensor data, we just display it in some fancy ways, and in case of roof inconsistency, a big warning is displayed.
What we do with the relay data is to compare it with the saved values from the switches, so, if we close the CCD switch, but the Dragonfly says it is open, a “working” icon is displayed. It both match, a checkmark is displayed. I’ve been unable to place the check side by side with the switch, but decided I’ve had enough! 🙂
So, in conclusion, I’ve liked the process very much, it really allows for integrating information from many sources easily, and make something relatively nice even for someone as blind to design as myself.
Things left for later (I’ll very much welcome any contribution):
- I’d like to be able to change the color of the sky temp chart depending on the temperature (like the clear / cloudy / overcast sections in the Solo graph).
- The humidity / light / rain display should be nicer. Humidity at least change color depending on its value, and for rain and light I’d like to see icons instead of the value.
- In general, I’d like to improve the look of it.